Sussex County Market Watch
Jan-Feb 2021 Real Estate Market Activity for Delaware Beach Areas
JAN – FEB 2021 REAL ESTATE MARKET WATCH The statistics referenced here are based on single family homes derived from the Bright Multiple Listing Service. Active Listings/Current Inventory As of the end of February, there were a total of 650 homes on the market, a decrease of 13% from the previous month’s end inventory of … Continue reading Jan-Feb 2021 Real Estate Market Activity for Delaware Beach Areas
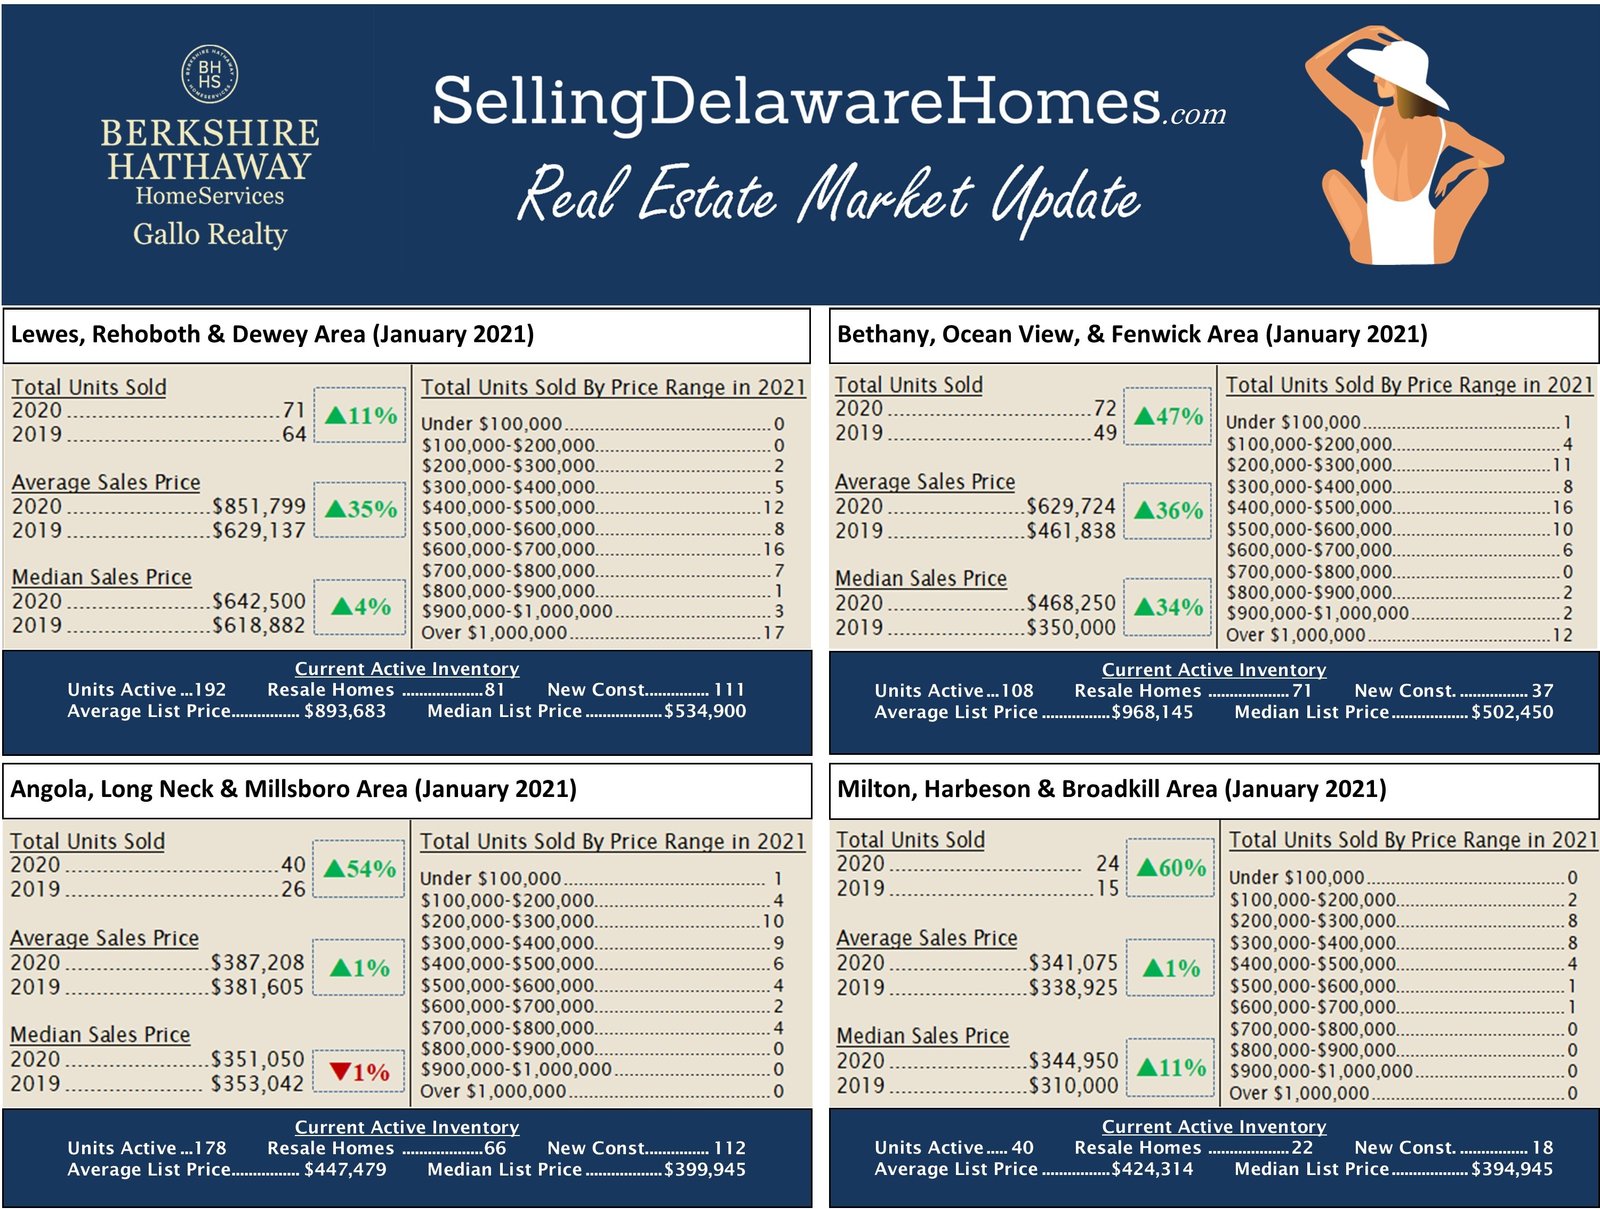
January 2021 Real Estate Market Activity for Delaware Beach Areas
JANUARY 2021 REAL ESTATE MARKET WATCH The statistics referenced here are based on single family homes derived from the Bright Multiple Listing Service. Active Listings/Current Inventory As of the end of January, there were a total of 743 homes on the market, a decrease of 10% from the previous month’s end inventory of 823. This … Continue reading January 2021 Real Estate Market Activity for Delaware Beach Areas

What Sold in the Delaware Beach Areas
WHAT SOLD? Properties listed represent both single family and condo/townhomes that are “fee simple” (meaning they are not subject to ground rent) that were sold last week. They ranged in price from a low of $107,000 to a high of $1,855,000. All Properties listed are located in our areas of expertise – Rehoboth Beach, Dewey … Continue reading What Sold in the Delaware Beach Areas

What Sold at the Beach Jan 24 – Jan 31
WHAT SOLD? 77 Properties (both single family and condo/townhomes) sold last week. They ranged in price from a low of $150,000 to a high of $2,264,000. All Properties were “fee simple” and were located in Rehoboth Beach, Dewey Beach, Lewes, Milton, Bethany Beach, Fenwick Island, Harbeson, Millsboro, Ocean View, Millville, Frankford, Dagsboro and Selbyville. Click … Continue reading What Sold at the Beach Jan 24 – Jan 31

What Sold at the Beach Jan 17 – Jan 24
WHAT SOLD? 45 Properties (both single family and condo/townhomes) sold last week. They ranged in price from a low of $210,000 to a high of $3,200,000. All Properties were “fee simple” and were located in Rehoboth Beach, Dewey Beach, Lewes, Milton, Bethany Beach, Fenwick Island, Harbeson, Millsboro, Ocean View, Millville, Frankford, Dagsboro and Selbyville. Click … Continue reading What Sold at the Beach Jan 17 – Jan 24
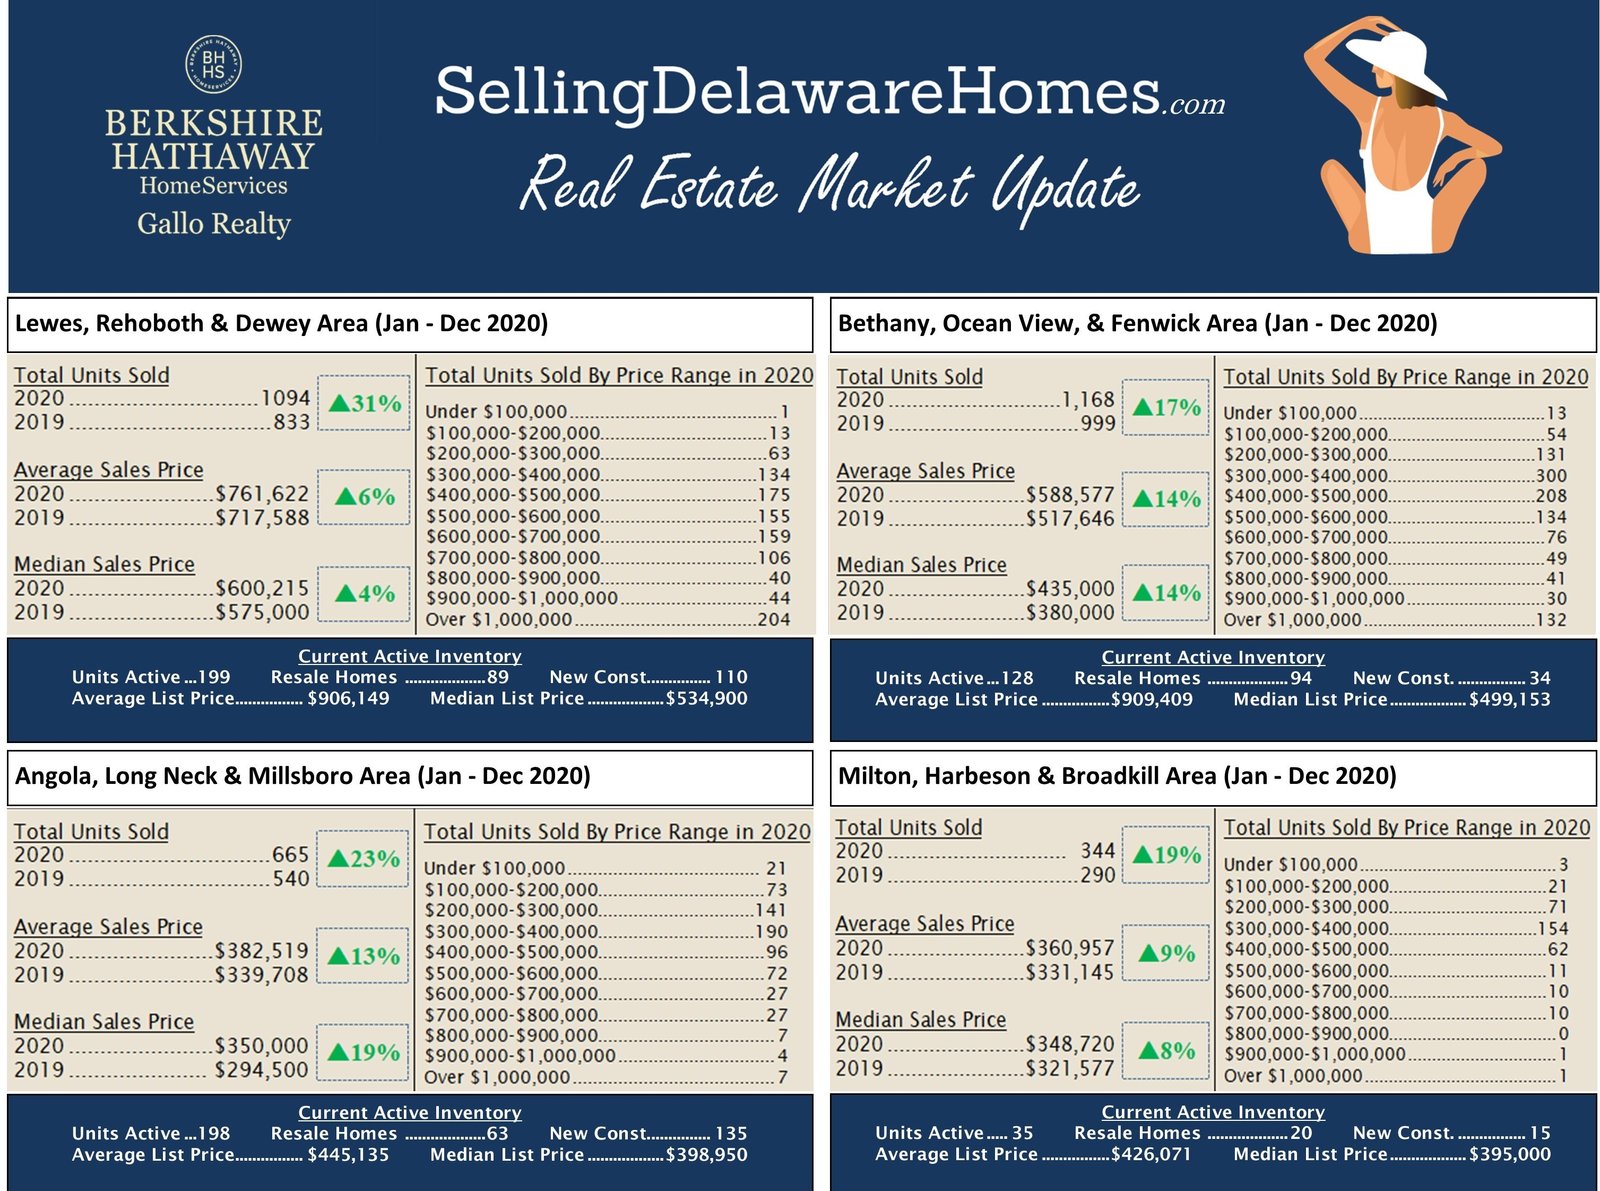
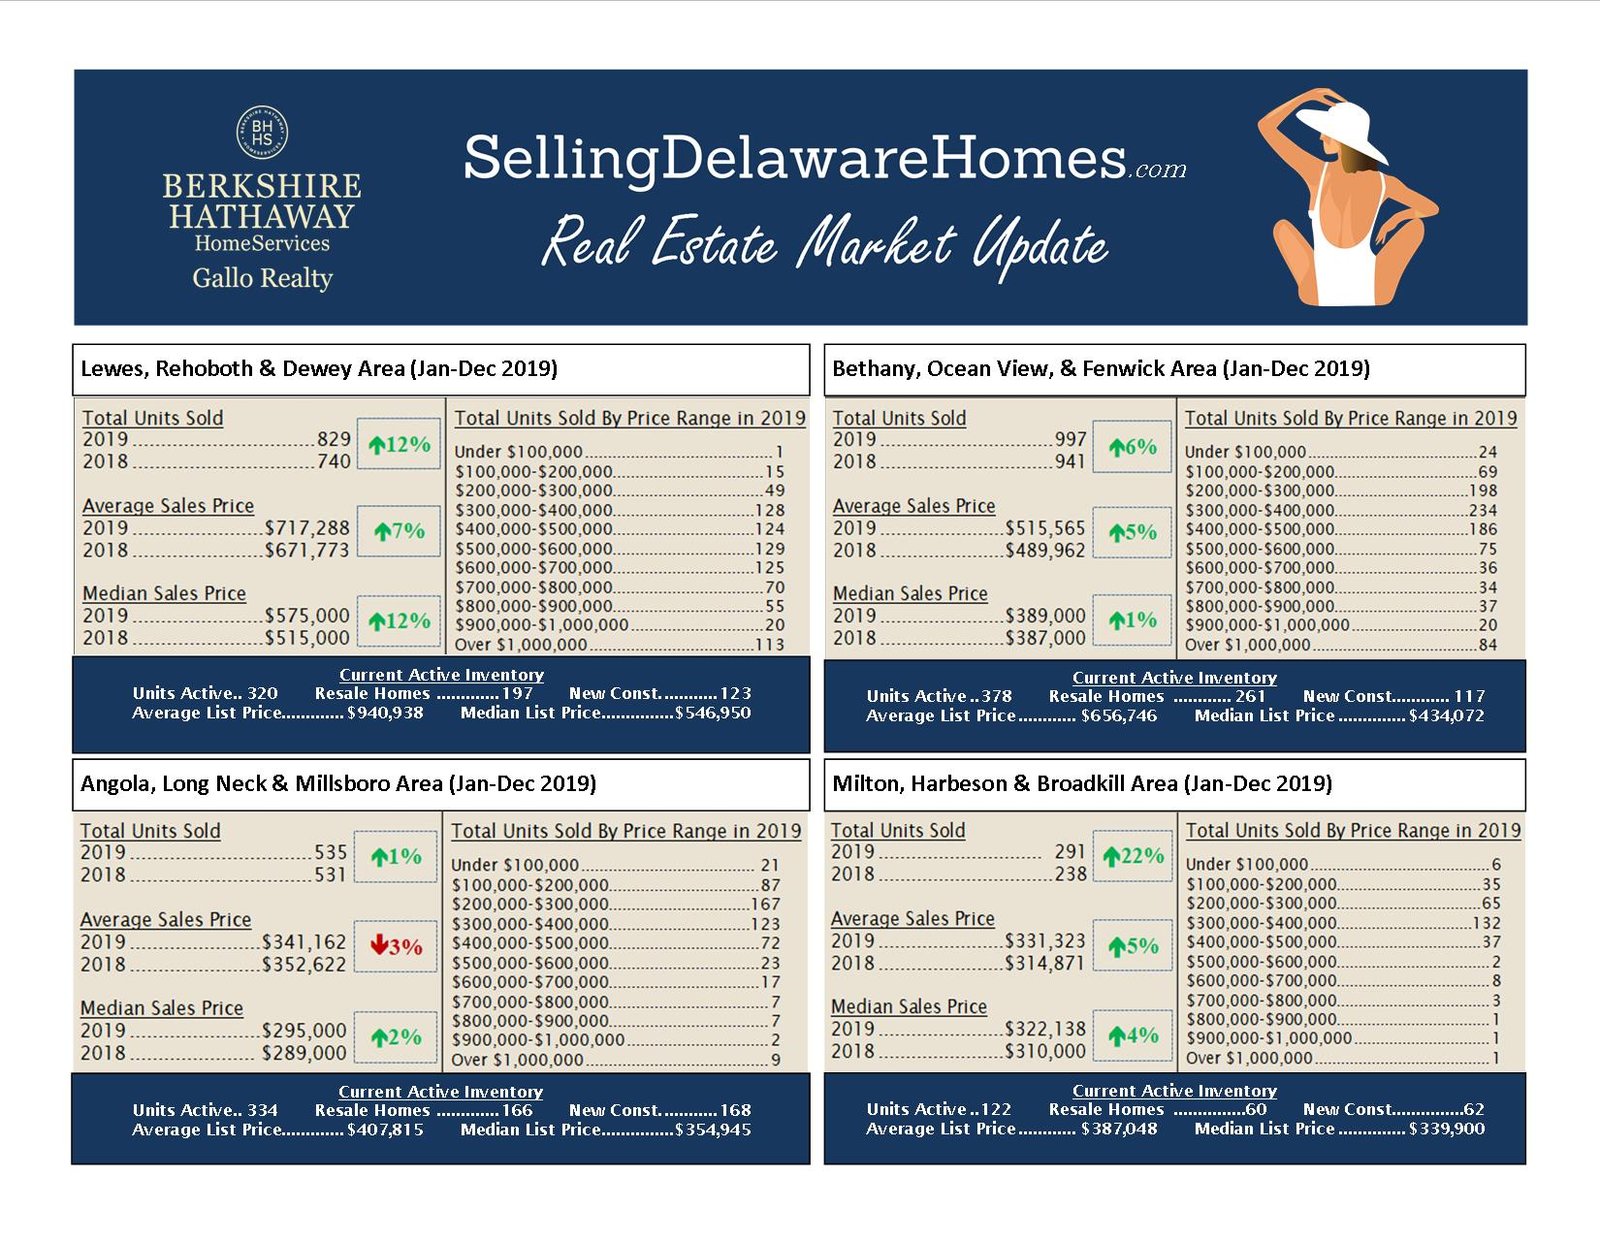
2020 Year End Real Estate Market Watch
Real Estate Market Watch for Year End 2020 – Sussex County, Delaware The statistics referenced here are based on single family homes derived from the Bright Multiple Listing Service. Active Listings/Current Inventory As of the end of December, there were a total of 823 homes on the market, a decrease of 9% from the … Continue reading 2020 Year End Real Estate Market Watch
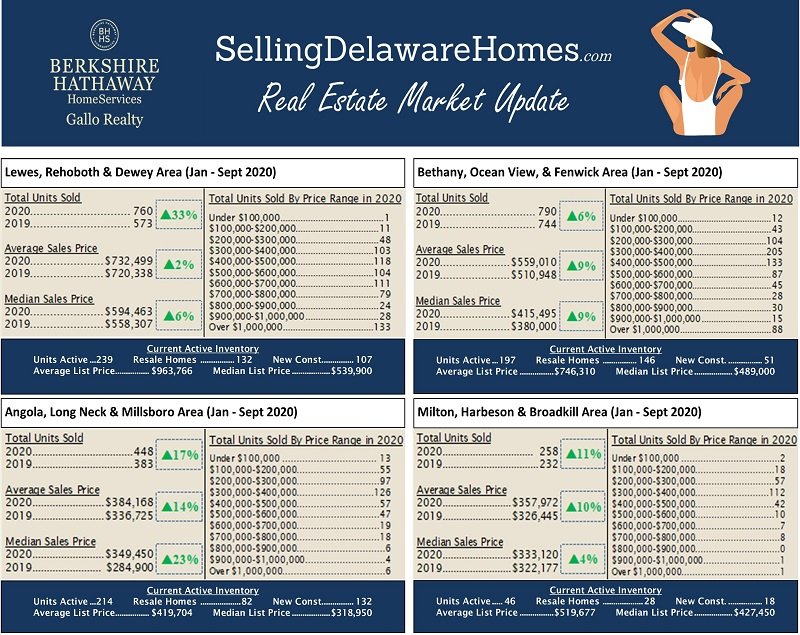
October 2020 Market Watch
October 2020 Market Watch The statistics referenced here are based on single family homes derived from the Bright Multiple Listing Service. Active Listings/Current Inventory As of the end of September, there were a total of 1,011 homes on the market, a decrease of 11% from the previous month’s end inventory of 1,132. This represents … Continue reading October 2020 Market Watch
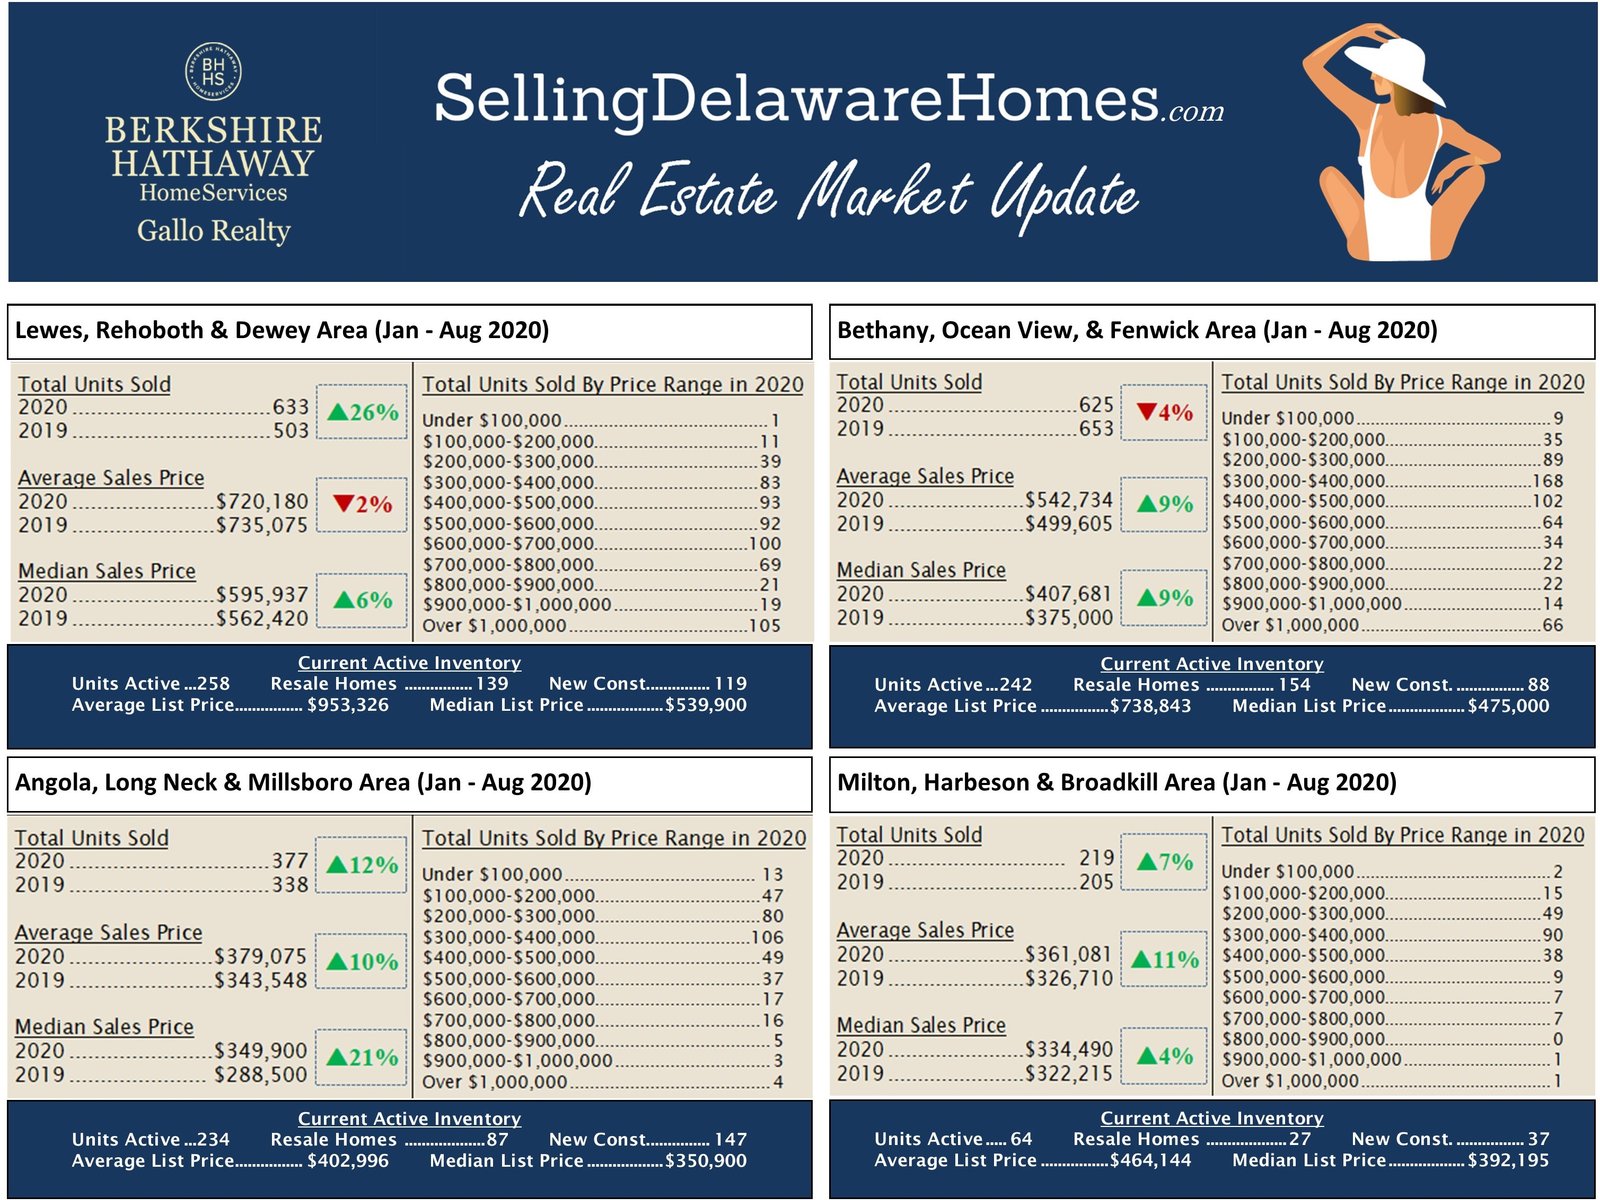
Real Estate Market Activity Sussex County August 2020
Real Estate Market Watch – August 2020 The statistics referenced here are based on single family homes derived from the Bright Multiple Listing Service. Active Listings/Current Inventory As of the end of August, there were a total of 1,132 homes on the market, a decrease of 11% from the previous month’s end inventory of 1,271. … Continue reading Real Estate Market Activity Sussex County August 2020

Real Estate Activity 1st Qtr. 2020 Sussex County
Current Market Conditions for Sussex County, DE (as of 3/31/2020—based on sales of single-family homes) Active Listings/Current Inventory As of the end of March, there were a total of 1,663 homes on the market, a minmimal decrease from the previous month’s end inventory of 1,666. This represents a 6-month’s supply of inventory, with a current … Continue reading Real Estate Activity 1st Qtr. 2020 Sussex County
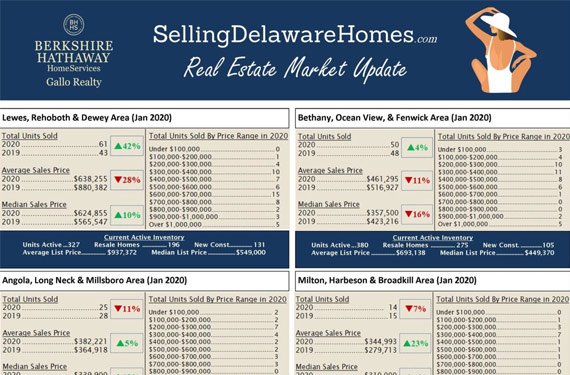
January 2020 Real Estate Market Update
January 2020 Real Estate Market Update Active Listings/Current Inventory As of the end of January, there were a total of 1,628 homes on the market, a decrease of 1% from the previous month’s end inventory of 1,639. This represents a 6-month’s supply of inventory, with a current absorption rate of 255 homes sold per month … Continue reading January 2020 Real Estate Market Update
Real Estate Market Update – December 2019
Real Estate Market Watch – December 2019 Active Listings/Current Inventory As of the end of December, there were a total of 1,639 homes on the market, a decrease of 5% from the previous month’s end inventory of 1,722. This represents a 5-month’s supply of inventory, with a current absorption rate of 344 homes sold per … Continue reading Real Estate Market Update – December 2019

Real Estate Market Update – November 2019
Real Estate Market Watch – November 2019 Active Listings/Current Inventory As of the end of November, there were a total of 1,722 homes on the market, a decrease of 5% from the previous month’s end inventory of 1,805. This represents a 5-month’s supply of inventory, with a current absorption rate of 341 homes sold per … Continue reading Real Estate Market Update – November 2019