The statistics referenced here are based on single family homes sold in Sussex County, Delaware, and are compiled from the Bright Multiple Listng Service.
Active Listings/Current Inventory
As of the end of December, there were a total of 1,842 homes on the market, a decrease of 6% from the previous month’s end inventory of 1,952. This represents a 6-month’s supply of inventory, with a current absorption rate of 299 homes sold per month thus far in 2018. Of the total inventory, 36% (662 homes) of the homes available are new construction.
Closed Sales
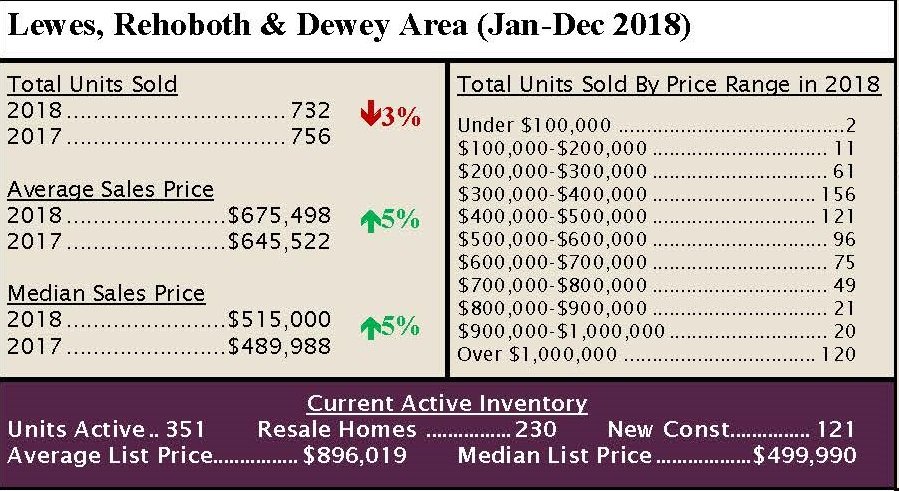
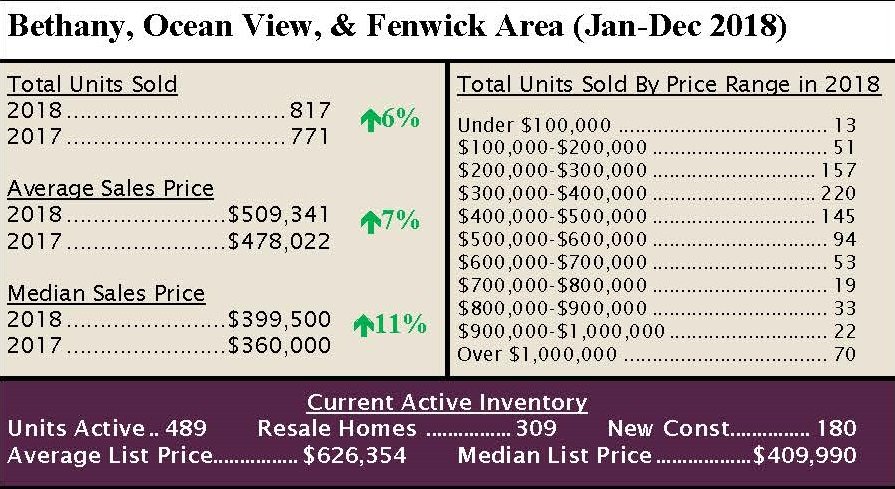
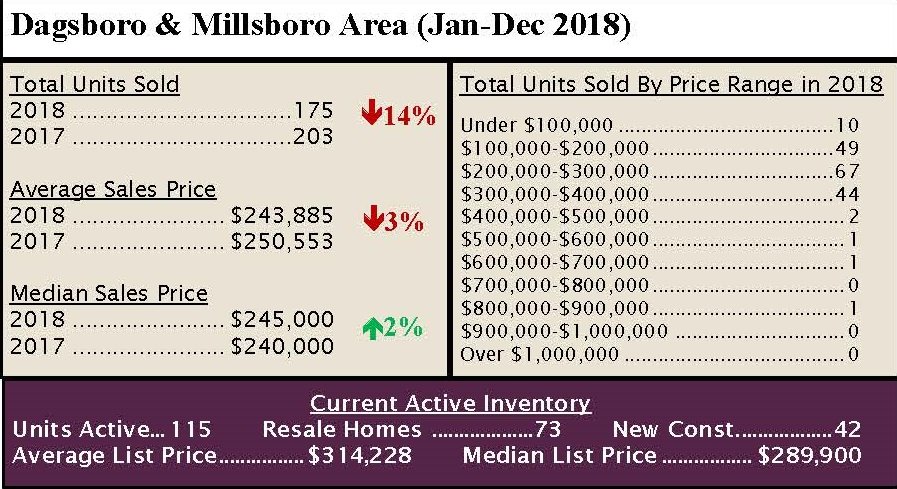
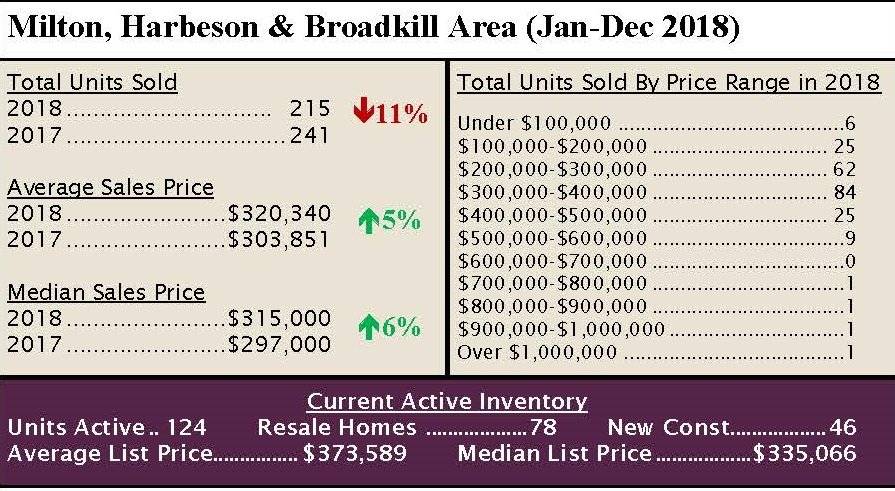
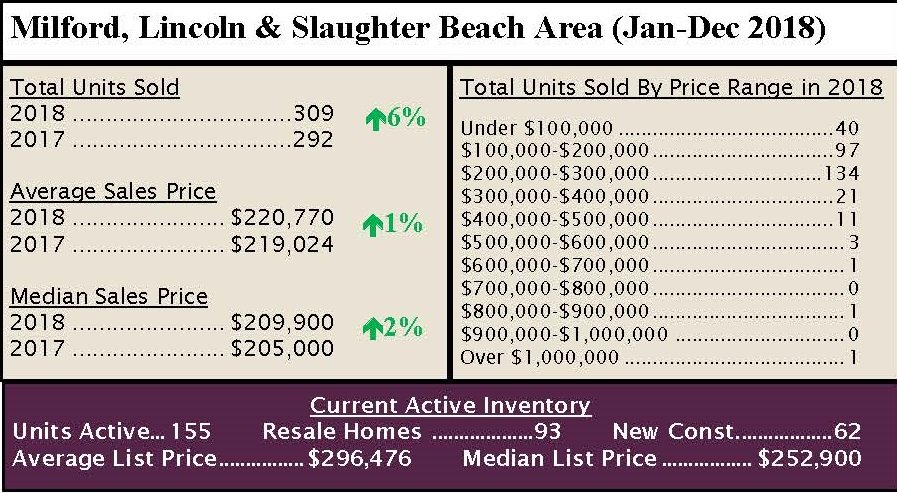
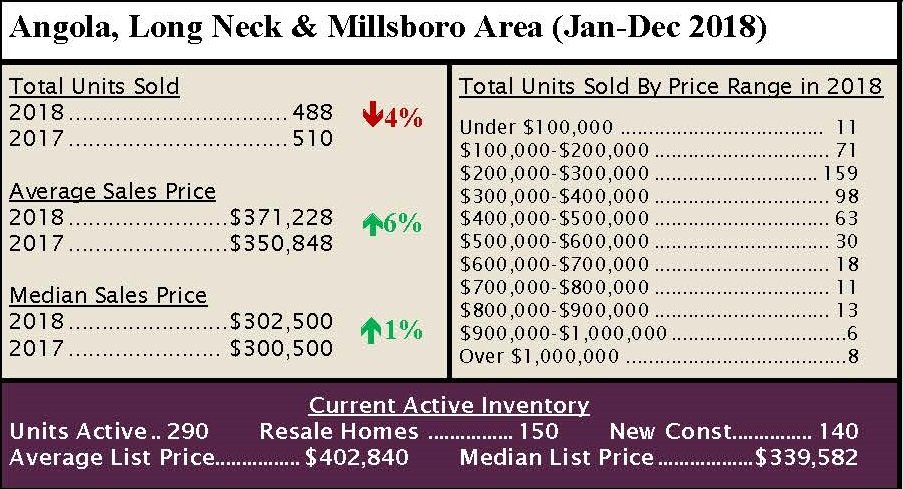
For the year ending 2018, sales of single-family homes in Sussex County are down 1% from last year, with 3,583 homes sold compared to 3,612 for the year ending 2017. The areas with the largest increase were the Georgetown Area, up 6% and the Bethany/Ocean View/Fenwick Area, up 6% . The areas with the largest decrease are the Dagsboro/Millsboro Area, down 14% and the Milton Area, down 11% from last year to date.
Home Prices
The average sales price of single-family homes in Sussex County are up over last year, $404,721 compared to $380,087, a 6% increase. The median sales price was up by 7% over 2017, $307,000 compared to $288,000.
Pending Sales
Pending sales for the year ending 2018 were down by 3% from last year, with 3,762 homes going under contract through December of 2018, compared to 3,888 in 2017.
Days on Market
The average days on market for homes to go under contract has decreased by 14% for homes sold through December of this year compared to last. In 2018, the current average days on market is 115 days, compared to 133 days through December of 2017.