The statistics referenced here and in the attached newsletter are based on single family homes sold in Sussex County, Delaware, and are compiled from the Bright Multiple Listing Service.
Active Listings/Current Inventory
As of the end of October, there were a total of 2,017 homes on the market, a decrease of 3% from the previous month’s end inventory of 2,081. This represents a 7-month’s supply of inventory, with a current absorption rate of 304 homes sold per month thus far in 2018. Of the total inventory, 31% (626 homes) of the homes available are new construction.
Closed Sales
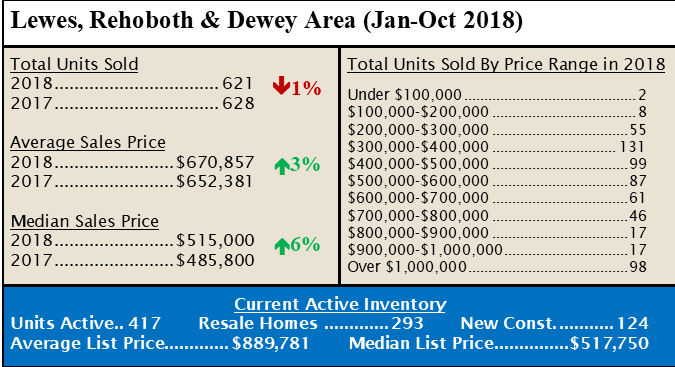
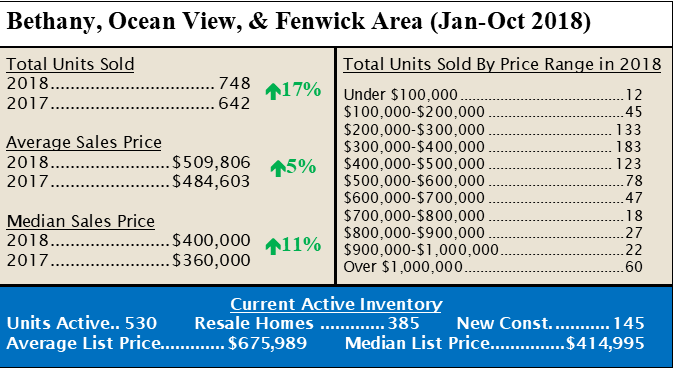
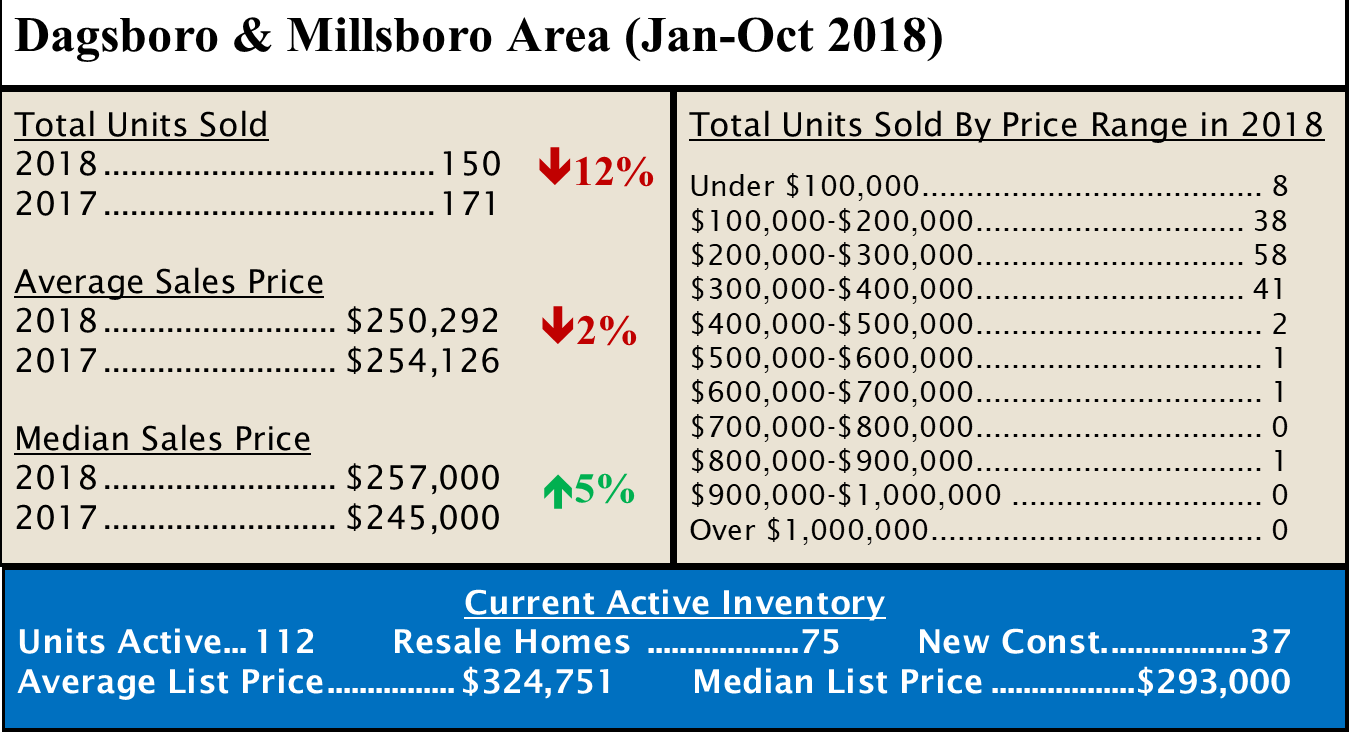
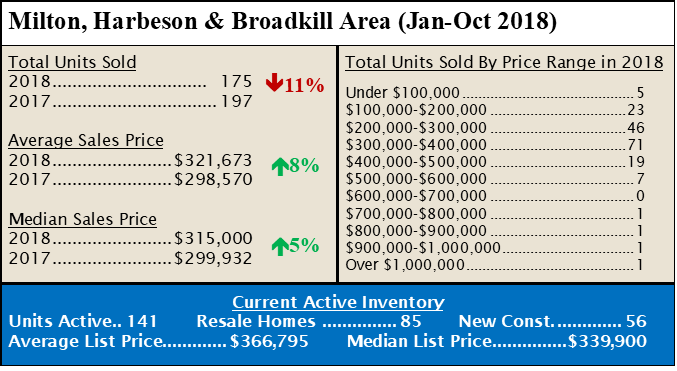
For the first ten months of 2018, sales of single-family homes in Sussex County are up 2% from last year, with 3,041 homes sold compared to 2,986 for the first ten months of 2017. The areas with the largest increase were the Georgetown Area, up 23% and the Bethany/Ocean View/Fenwick Area, up 17%. The areas with the largest decrease are the Dagsboro/Millsboro Area, down 12% and the Milton Area, down 11% from last year to date.
Home Prices
The average sales price of single-family homes in Sussex County are up over the first 10-month period of last year, $403,298 compared to $380,578, a 6% increase. The median sales price was up by 6% over the first 10-month of 2017, $305,000 compared to $287,500.
Pending Sales
Pending sales for the first nine months of 2018 were down by 1% from last year, with 3,310 homes going under contract through October of 2018, compared to 3,345 in 2017.
Days on Market
The average days on market for homes to go under contract has decreased by 13% for homes sold through October of this year compared to last. In 2018, the current average days on market is 117 days, compared to 134 days through October of 2017.