As of the end of January, there were a total of 1,769 homes on the market, a decrease of 3% from the previous month’s end inventory of 1,824. This represents a 9-month’s supply of inventory, with a current absorption rate of 207 homes sold per month thus far in 2018.
Closed Sales
For the first month of 2018, sales of single-family homes in Sussex County are slightly down from last year, with 207 homes sold compared to 210 for the first month of 2017. The areas with the largest increase were the Milford Area, up 38% and the Georgetown Area, up 20%. The areas with the largest decrease were Western Sussex County, down 28% and the Milton/Harbeson/Broadkill Area, down 20% from last year to date.
Home Prices
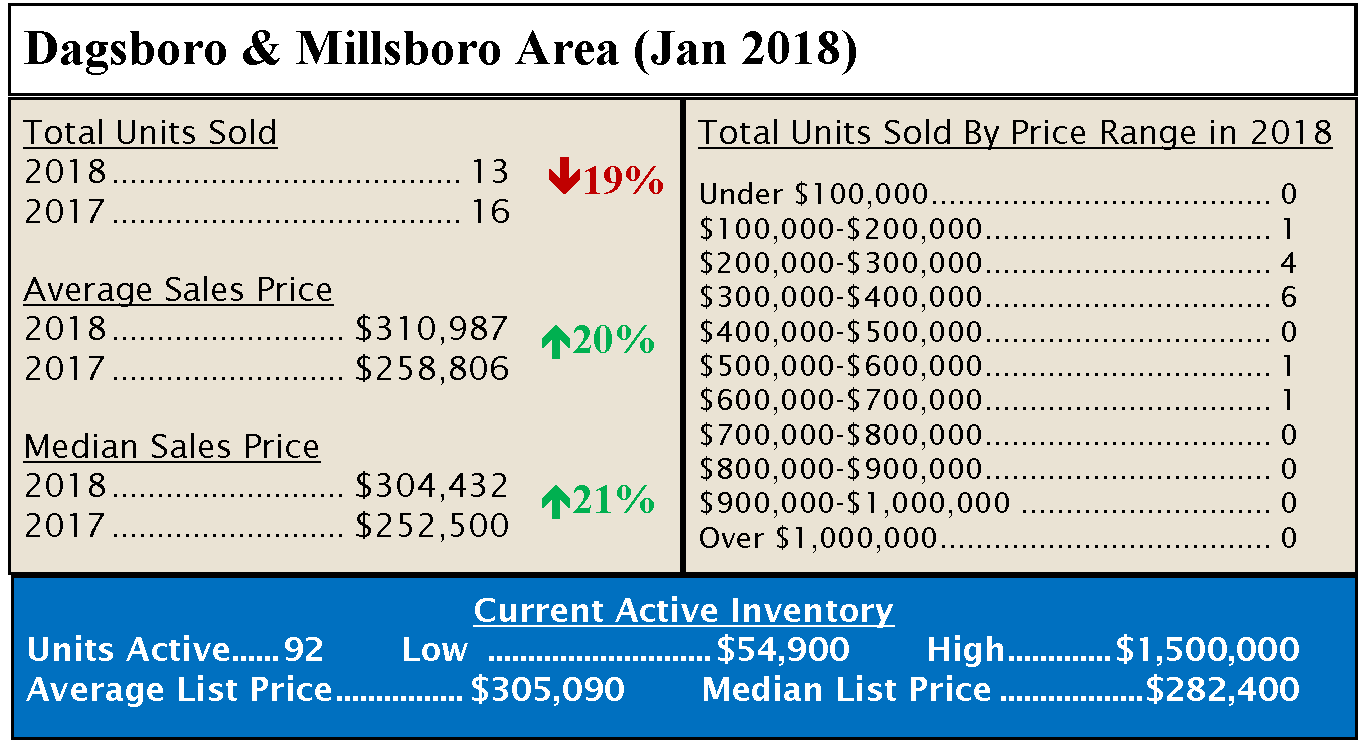
The average sales price of single-family homes in Sussex County are up over the first 1-month period of last year, $404,227 compared to $356,543, a 13% increase. The median sales price was up by 18% over the first 1-month of 2017, $304,432 compared to $257,500.
Pending Sales
Pending sales for the first month of 2018 were up by 2% over last year, with 253 homes going under contract during January of 2018, compared to 249 in 2017.
Days on Market
The average days on market for homes to go under contract has decreased by 7% for homes sold in January of this year compared to last. In 2018, the current average days on market is 123 days, compared to 132 days through January of 2017.